
Generate Graphical JMeter Report at the End of Test Run

Reporting is one of the most crucial tasks in any project’s QA activities. And in load tests, your report is expected to be comprehensive enough for concerned stack holders. However, we have seen many JMeter users complain about lack of reporting capability in JMeter. This article therefore shows a simple trick to generate graphical JMeter report at the end of test run.
This JMeter report is generated in HTML format using Apache Ant tool. So, make sure you have Apache Ant installed and configured properly in your system. After that perform below steps to generate the HMTL report.
  • Navigate to ‘extras’ directory in your JMeter setup.
  • Open build.xml file located there in choice of your editor.
  • Search for ‘style’ attribute in ‘xslt-report’ target of opened Ant file.
  • Set ‘style’ value to ‘C:/apache-jmeter-2.11/extras/jmeter-results-detail-report${style_version}.xsl’. Change JMeter directory value as per your installation.
  • Save build.xml file and close it.
  • Copy your JMeter script(JMX file) in ‘extras’ directory of JMeter.
  • Now, open Command Prompt and navigate to ‘extras’ directory.
  • Run following command to start load test.

    For example if your script name is TestScript.jmx, your command should be as below.
  • After completion of test run, you should see HTML report in ‘extras’ directory. It should look like below.

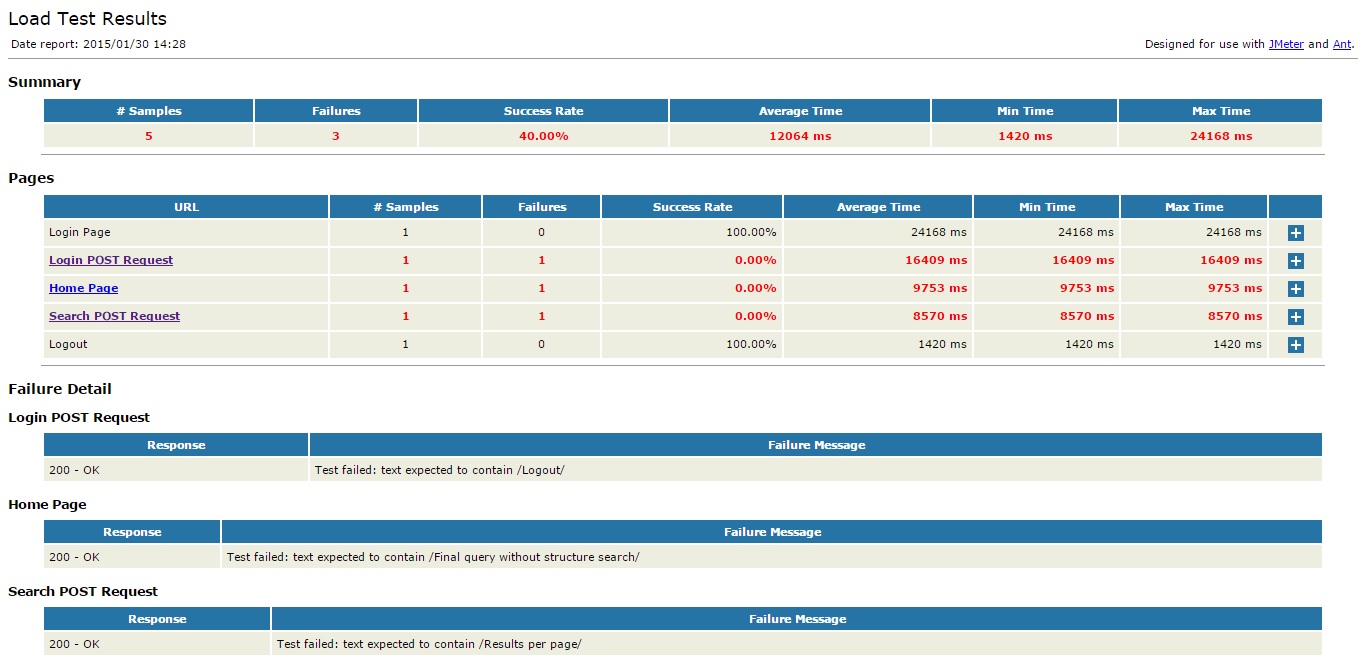
  • As you can see in above screenshot, the HTML report contains essentials details such as failure cause, average response time, minimum and maximum times, failure rate etc. You can send this HTML file as part of your performance test result report.
Since JMeter’s capability to generate report out of the box is limited, above trick to generate graphical JMeter report may come in handy to you at some point. Do you know any other ways we can generate reports in JMeter? Share with us in comments.

Comments

Popular posts from this blog

JMeter Exceeded Maximum Number of Redirects Error Solution

While running performance test, JMeter allows maximum 5 redirects by default. However, if your system demands more than 5 redirects, it may result in JMeter exceeded maximum number of redirects error. In this post, we have listed down steps to overcome this error. Actual error in JMeter: Response code: “Non HTTP response code: java.io.IOException” Response message: “Non HTTP response message: Exceeded maximum number of redirects: 5” This error is noticed because  JMeter  allows maximum 5 redirects by default and your system may be using more than 5 redirects. You need to increase this count to more than 5 in jmeter.properties file. Follow below steps to achieve this. Navigate to /bin directory of your JMeter installation. Locate jmeter.properties file and open it in any editor. Search for “httpsampler.max_redirects” property in opened file. Uncomment the above property by removing # before it. Change to value to more than 5 Eg. 20. Save the file and restart JMet...

Performance Testing in the Cloud with JMeter & AWS

JMeter is a wonderful tool  to stress test your website and  your application architecture , however if you are trying to simulate many users (>1000) one JMeter instance (=pc) will not be sufficient. You will have to set up a JMeter cluster with multiple machines. JMeter is capable or running  distributed tests , but it comes with limitations. Since most of us don’t have multiple servers laying around somewhere, we usually go to cloud service providers like  AWS , spin up a couple of  EC2 instances  and turn them off whenever we’re done. Here is the problem, JMeter uses  Java RMI (Remote Method Invocation)  to communicate to its slaves, but these connections require all machines to be on the same subnet and this is not feasible with EC2 instances. Below, I explain how to get around this problem using a 3 node configuration in AWS to execute tests. I assume that you have a written the test already and have the .jmx file r...

Difference Between Redirect Automatically and Follow Redirects in JMeter

In this post, we will highlight important difference between Redirect Automatically and Follow Redirects options. These options are found in HTTP Request sampler of JMeter. Knowing the difference will help you decide your performance test strategy. When you check Redirect Automatically option, JMeter will not consider redirect as separate HTTP request. This in turn may result as lower response time in your overall performance test. Whereas Follow Redirect option will consider each redirection as separate requests. This may result in comparatively higher response time. This only has any effect if “Redirect Automatically” is not enabled. To see the difference between these two, record a sample script and run it by checking Redirect Automatically and Follow Redirects option. The second option will generate more requests in your result listener. As you can see from the above post, knowing the difference between Redirect Automatically and Follow Redirects option makes difference i...