I would like to show you performance testing of webservices using soap ui.
Performance testing of web services is not just running SOAP or XML messages in a loop to run the service. It should be a well-planned activity which must be aligned with the performance expectations of the overall service-oriented solution. You can run multiple type of performance test such as SOAP , JSON, XML format messaging through a single interface
SoapUI allows users to configure various load testing options such as delays in between threads to simulate real-world use cases and run tests in burst mode to stress test services.
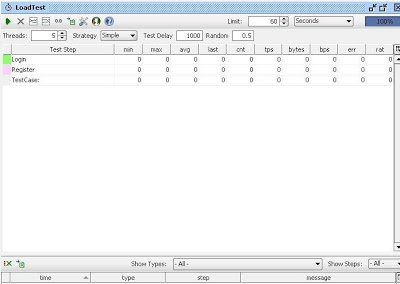
How to create Load Test: Just go to Navigation bar of soapUI click on your create soaui project and expand test case. Right click on “load test” options, enter load test name on opened window and click on OK button. Your created load test window looks like as below.

As in above screenshot have two soap ui test method “login” and “Register” both methods are automatically reflect on load test window.
Load Test Limit: load test limit define interval of test case execution. SoapUI has two variable for limit 1. Limit value 2. Limit type. Limit type has three options “Total Runs”, “seconds” “Runs per thread”
1. Total Runs limit type is used to set the number of times the TestCase needs to be executed during each load test run.
2. Seconds, lumit type is used to be execute of load test for a particular time.
3 .Runs per thread limit type is used to set number of time to be execute per thread of TestCase.


Performance testing of web services is not just running SOAP or XML messages in a loop to run the service. It should be a well-planned activity which must be aligned with the performance expectations of the overall service-oriented solution. You can run multiple type of performance test such as SOAP , JSON, XML format messaging through a single interface
SoapUI allows users to configure various load testing options such as delays in between threads to simulate real-world use cases and run tests in burst mode to stress test services.
How to create Load Test: Just go to Navigation bar of soapUI click on your create soaui project and expand test case. Right click on “load test” options, enter load test name on opened window and click on OK button. Your created load test window looks like as below.
As in above screenshot have two soap ui test method “login” and “Register” both methods are automatically reflect on load test window.
Load Test Limit: load test limit define interval of test case execution. SoapUI has two variable for limit 1. Limit value 2. Limit type. Limit type has three options “Total Runs”, “seconds” “Runs per thread”
1. Total Runs limit type is used to set the number of times the TestCase needs to be executed during each load test run.
2. Seconds, lumit type is used to be execute of load test for a particular time.
3 .Runs per thread limit type is used to set number of time to be execute per thread of TestCase.
Threads: Threads act as virtual users in a load test. If the thread count is set as N, soapUI creates N number of clones of the associated TestCase and executes them.
Load test strategies: following type load strategies are used in soau UI
1. Simple
2. Burst
3. Thread
4. Variance
Set any load strategy as your requirement and click on run icon. After execution your window looks like as below screen.

Comments
Post a Comment