
Top command and options- Performance Measurement commands for Unix

Top command and options


What server side statistics should be gathered during performance testing. We have not yet looked in to specific statistics which we should gather for server side monitoring. In this post we would have a look at useful Linux commands which can be used to gather several important performance statistics. We would use these commands in future performance testing tutorials to gather server side performance statistics. Most of the description of these commands is from command manual. So lets begin -  

The top program provides a dynamic real-time view of a running system.  It can display system summary information as well as a list of processes or threads currently being managed by the Linux kernel.

Type the following command:

$ top
top.png

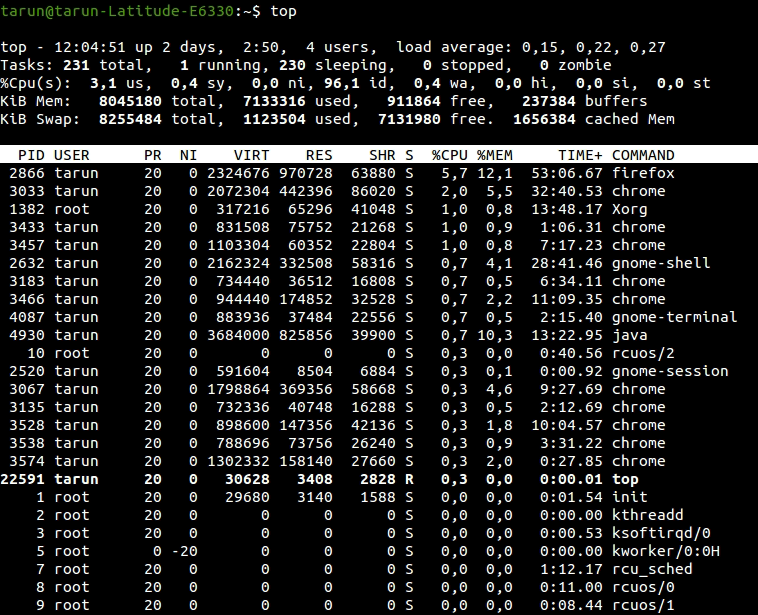
The top command used to display all the running and active real-time processes in ordered list and updates it regularly. Press ‘c‘ option in running top command, it will display absolute path of running process.
If you want to kill a running process then use kill command as - {kill -9 <process-id>}

Press (Shift+W) to save the running top command results under /root/.toprc.

OPTIONS

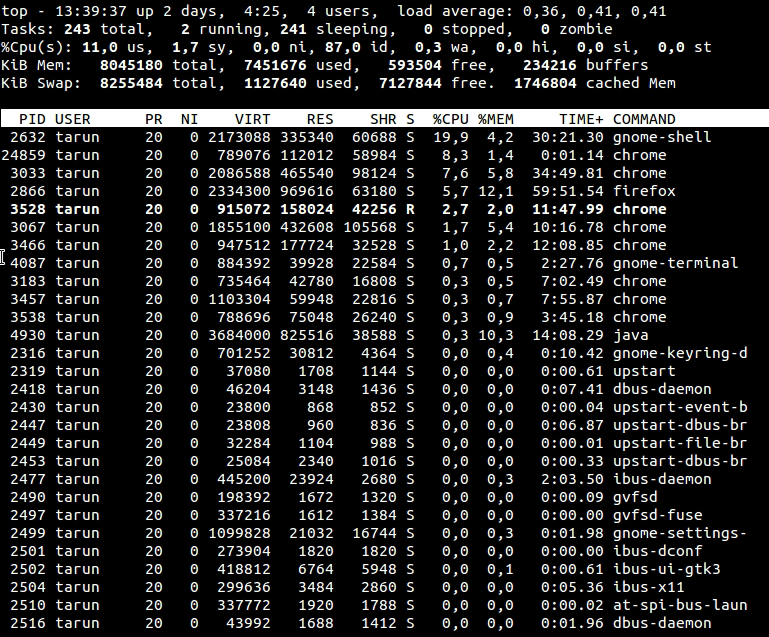
-u | -U  :User-filter-mode as:  -u | -U number or name
Display only processes with a user id or user name matching that given.  The '-u' option matches on  effective user whereas  the  '-U' option matches on any user (real, effective, saved, or filesystem).

Prepending  an  exclamation point ('!') to the user id or name instructs top to display only processes with users not matching the one provided.
$ top -u tarun
replace tarun with your username ;-)

top.png

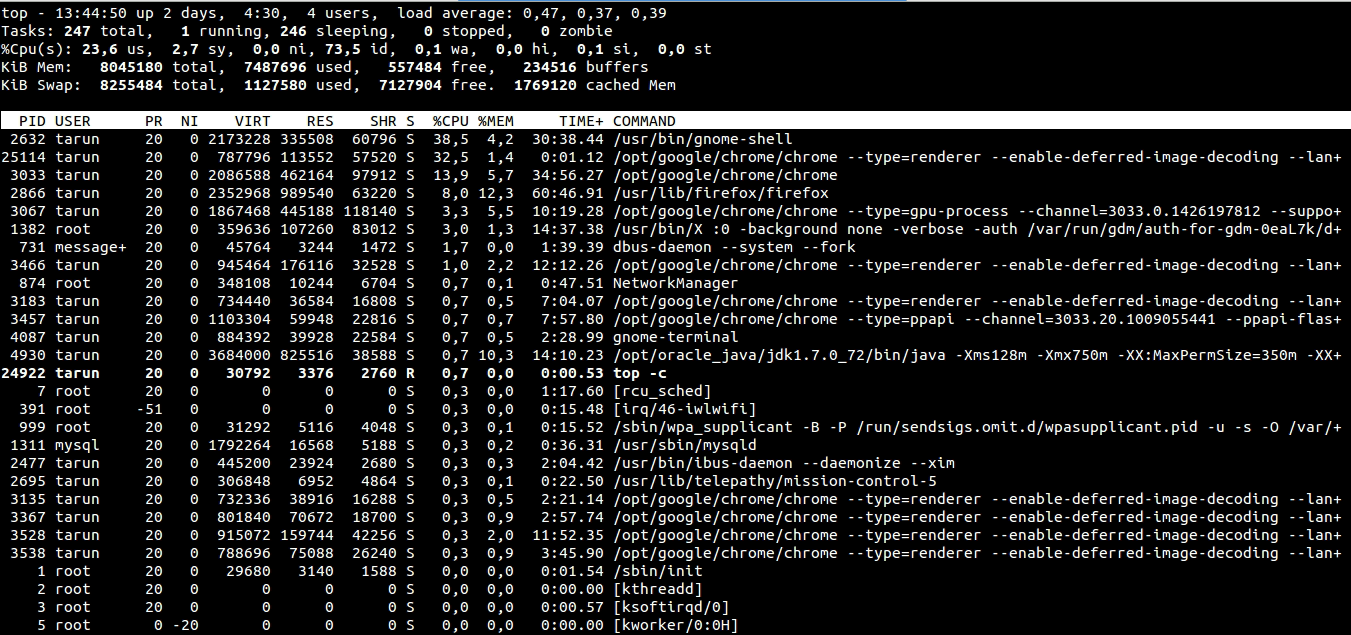
-c  :Command-line/Program-name toggle Starts top with the last remembered 'c' state reversed. Thus, if top was displaying command lines, now that field will show program        names, and visa versa. See the 'c' interactive command for additional information. You can use this command to display absolute path of running process.
$ top -u tarun

top.png
-d  :Delay-time interval as: -d ss.t (secs.tenths) Specifies the delay between screen updates, and overrides the corresponding value in one's personal configuration file or the startup default.

$ top -d 1

No screen capture, try it yourself ;-)


Comments

Popular posts from this blog

JMeter Exceeded Maximum Number of Redirects Error Solution

While running performance test, JMeter allows maximum 5 redirects by default. However, if your system demands more than 5 redirects, it may result in JMeter exceeded maximum number of redirects error. In this post, we have listed down steps to overcome this error. Actual error in JMeter: Response code: “Non HTTP response code: java.io.IOException” Response message: “Non HTTP response message: Exceeded maximum number of redirects: 5” This error is noticed because  JMeter  allows maximum 5 redirects by default and your system may be using more than 5 redirects. You need to increase this count to more than 5 in jmeter.properties file. Follow below steps to achieve this. Navigate to /bin directory of your JMeter installation. Locate jmeter.properties file and open it in any editor. Search for “httpsampler.max_redirects” property in opened file. Uncomment the above property by removing # before it. Change to value to more than 5 Eg. 20. Save the file and restart JMet...

Performance Testing in the Cloud with JMeter & AWS

JMeter is a wonderful tool  to stress test your website and  your application architecture , however if you are trying to simulate many users (>1000) one JMeter instance (=pc) will not be sufficient. You will have to set up a JMeter cluster with multiple machines. JMeter is capable or running  distributed tests , but it comes with limitations. Since most of us don’t have multiple servers laying around somewhere, we usually go to cloud service providers like  AWS , spin up a couple of  EC2 instances  and turn them off whenever we’re done. Here is the problem, JMeter uses  Java RMI (Remote Method Invocation)  to communicate to its slaves, but these connections require all machines to be on the same subnet and this is not feasible with EC2 instances. Below, I explain how to get around this problem using a 3 node configuration in AWS to execute tests. I assume that you have a written the test already and have the .jmx file r...

Difference Between Redirect Automatically and Follow Redirects in JMeter

In this post, we will highlight important difference between Redirect Automatically and Follow Redirects options. These options are found in HTTP Request sampler of JMeter. Knowing the difference will help you decide your performance test strategy. When you check Redirect Automatically option, JMeter will not consider redirect as separate HTTP request. This in turn may result as lower response time in your overall performance test. Whereas Follow Redirect option will consider each redirection as separate requests. This may result in comparatively higher response time. This only has any effect if “Redirect Automatically” is not enabled. To see the difference between these two, record a sample script and run it by checking Redirect Automatically and Follow Redirects option. The second option will generate more requests in your result listener. As you can see from the above post, knowing the difference between Redirect Automatically and Follow Redirects option makes difference i...